Introduction
wishpy announcement might be a good place to start, if you have not heard about what wishpy is.
The motivation for 'wishpy' since day one has been to be able to use Wireshark's excellent packet dissection features in Python programmatically. There are a couple of advantages of this approach -
- This offers a lot more flexibility in terms of what one can do with the packet data.
- It also offers developers a control over scaling the part of processing pipeline as needed, this is usually not possible just with
stdin/stdoutredirection.
For instance it's possible to use a single core to capture packets from the interface and multiple cores for dissecting those packets to scale up dissecting performance with the number of cores.
In the current blog, we'll look at one such application of wishpy where we'll look at how we can use wishpy to dump the data in Elastic and demonstrate as an example, a TCP Congestion Control in action using packet trace for a large file download inside Kibana.
More specifically, we'll be looking at -
- How to get the packets from a PCAP file into a Json format that is consumable by Elastic (this needs tweaking Wireshark's default Json output a bit.)
- How to manage the interpretation of Packet's Json data fields inside Elastic through Elastic's Dynamic Mappings.
- How to visualize this data inside Kibana, once the data is available inside Elastic.
Elastic Friendly 'json'
Before we can push the Packet Json into Elastic, we need to get the json in a format that is supported by Elastic. There are a few of things that need to be taken care of -
-
The fields names are dot separated, ie TCP Port field will be called
tcp.portin Wireshark's standards Json output. Since it is also possible to access object attributes using dot notation in Javascript, this ends up confusing Elastic's field mapping process. So we change all the dot separated fields names to underscore separated field names. Thus a field name liketcp.portbecomestcp_port. -
Also, even though elastic supports nested objects during indexing, it's a better idea if the objects are kept only a few layers deep. While the packet Json output from Wireshark can be multiple levels deep, it needs to be flattened into a simple hierarchy where we have at the first level all
protocolobjects and second levelprotocol_attributesobjects. -
Also, there are certain fields that appear duplicate at a given level and since this is not necessarily an error from the Json specification point of view (
SHOULDvsMUST), Elastic is not very happy with it. All such fields are collected asarrayfields.
Actually, the last part is a bit challenging. However Python's json.loads takes a parameter called - object_pairs_hook and this can be used to 'collect' such duplicate fields using the code as shown below. This SO question suggested the original idea how to go about it.
def get_elasticky_json(values):

    return_dict = {}
    for k,v in values:
        dict_key = k.replace(".", "_")
            if dict_key in return_dict:
                old = return_dict.pop(dict_key)
                if isinstance(old, list):
                    new = [v] + old
                else:
                    new = [old, v]
        return_dict[dict_key] = new
            else:
                return_dict[dict_key] = v

  return dict(return_dict)
The above function then can be used as object_pairs_hook callback, which will be called for every 'object' and will be passed a list of tuples (key, value). They can be collected in a dict as shown above.
Elastic Dynamic Mappings
Elastic uses what is called as 'field mappings' to infer the type of the data, even without being explicitly told to do so. This feature is particularly useful for a packet's json data, since in a given network trace, it is not possible to know a priori what kind of packets will be received and thus create mappings for the 'expected' fields. tshark supports a CLI switch through which it is possible to get data in an Elastic compatible Json. However since tshark dumps all fields as 'strings', it is required in the case of tshark to tell Elastic how to 'infer' the data. For instance 'TCP Port' is a numeric field and it should be treated as an integer and not as a string. In wishpy's implementation, no such explicit mapping is required to be told because we try to preserve the original type of a field as much as possible (ie numbers, booleans etc.). This allows 'wishpy' to get away with a very small mappings file without having to explicitly tell Elastic about how to map individual fields. In fact we only update a couple of mappings, and let Elastic infer everything else. The couple of mappings that we update include -
- Letting Elastic know the format of our Date fields. We are especially interested in frame timestamps. We can make use of the
Date Formatstrings to parse the date. - Most of the fractional numbers in Json are treated as 'double' type, but for the use cases often the numeric range supported by 'float' is sufficient. So we modify those mappings as well.
- Also, there is a configurable limit on number of dynamic fields that are supported per index in Elastic. This default value is 1000 dynamic mappings. We increase this limit to a suitable large number (5000 for now).
Thus our simple mapping looks as follows -
{
  "mappings" : {
    "dynamic_date_formats" : ["MMM dd, yyyy HH:mm:ss.nnnnnnnnn z || MMM  d, yyyy HH:mm:ss.nnnnnnnnn z"],
    "dynamic_templates": [
      {
        "unindexed_doubles" : {
          "match_mapping_type": "double",
          "mapping": {
            "type": "float",
            "index": false
          }
        }
      }
    ]
  },
  "settings": {
    "index": {
      "mapping": {
        "total_fields":{
          "limit": 5000
        }
      }
    }
  }
}
The mappings file like above can then be used along with Elastic's python API and 'wishpy'. The sample code is extremely simple and looks something like -
        ## Part of a class called `ElasticDumper` only relevant part shown

    def init(self):

        mappings_file_path = os.path.join(os.path.dirname(
                    os.path.abspath(__file__)), _MAPPINGS_FILE)

        with open(mappings_file_path, "r") as f:
            mappings_doc = f.read()

        try:
            self._index = self._elastic_handle.indices.create(
                self._index_name,
                body=mappings_doc,
                ignore=[])
        except Exception as e:
            _logger.exception("init")
            raise

    def run(self):
        count = 0
        for packet in self._dissector.run():
            try:
                self._elastic_handle.index(self._index_name, packet)
                count += 1
                if count % 1000 == 0:
                    print("processed {} packets".format(count))

            except Exception as e:
                _logger.exception(e)
The idea here is extremely simple, what we basically do is - take the 'mappings' file as described above and use it to 'create' an index. Then as we iterate through the packets returned by wishpy's Dissector, each packet is dumped into Elastic. There's some boilerplate code that is not shown here, but this should give the idea how simple it is to use 'wishpy' with any third party libraries inside Python.
TCP Congestion Control and Kibana
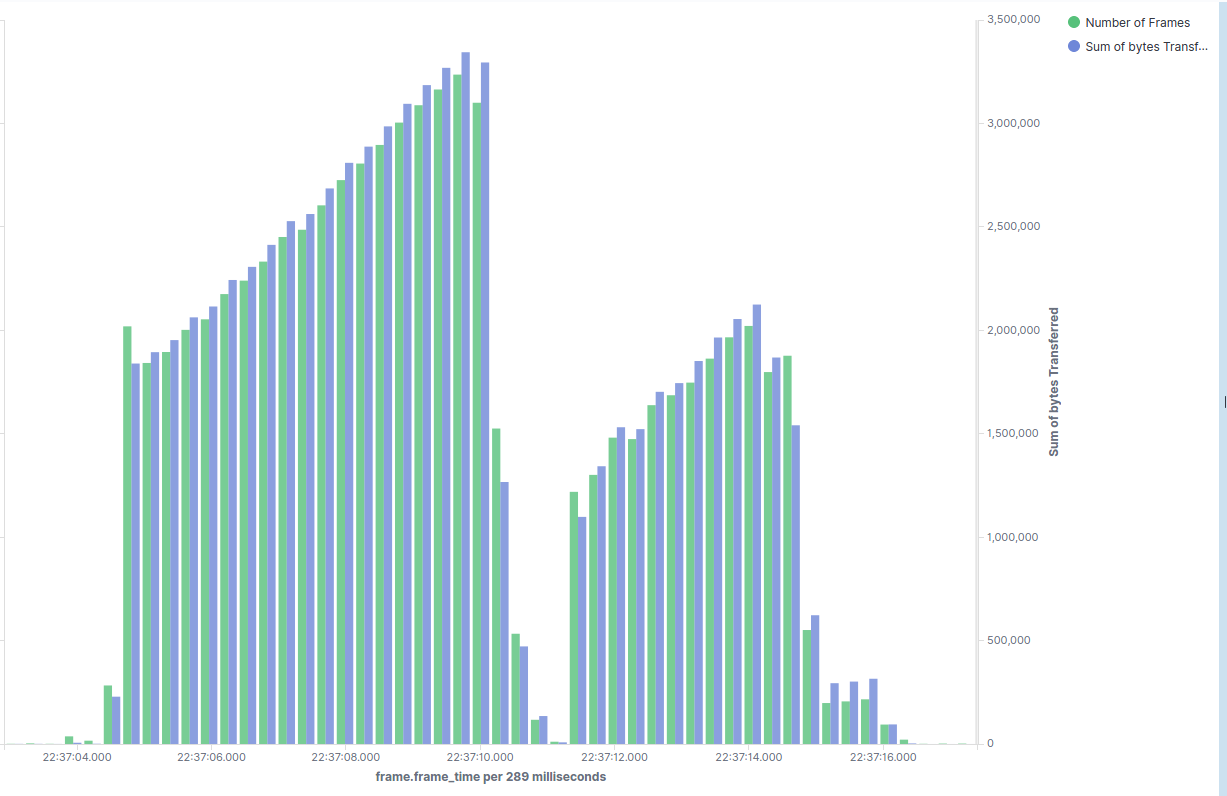
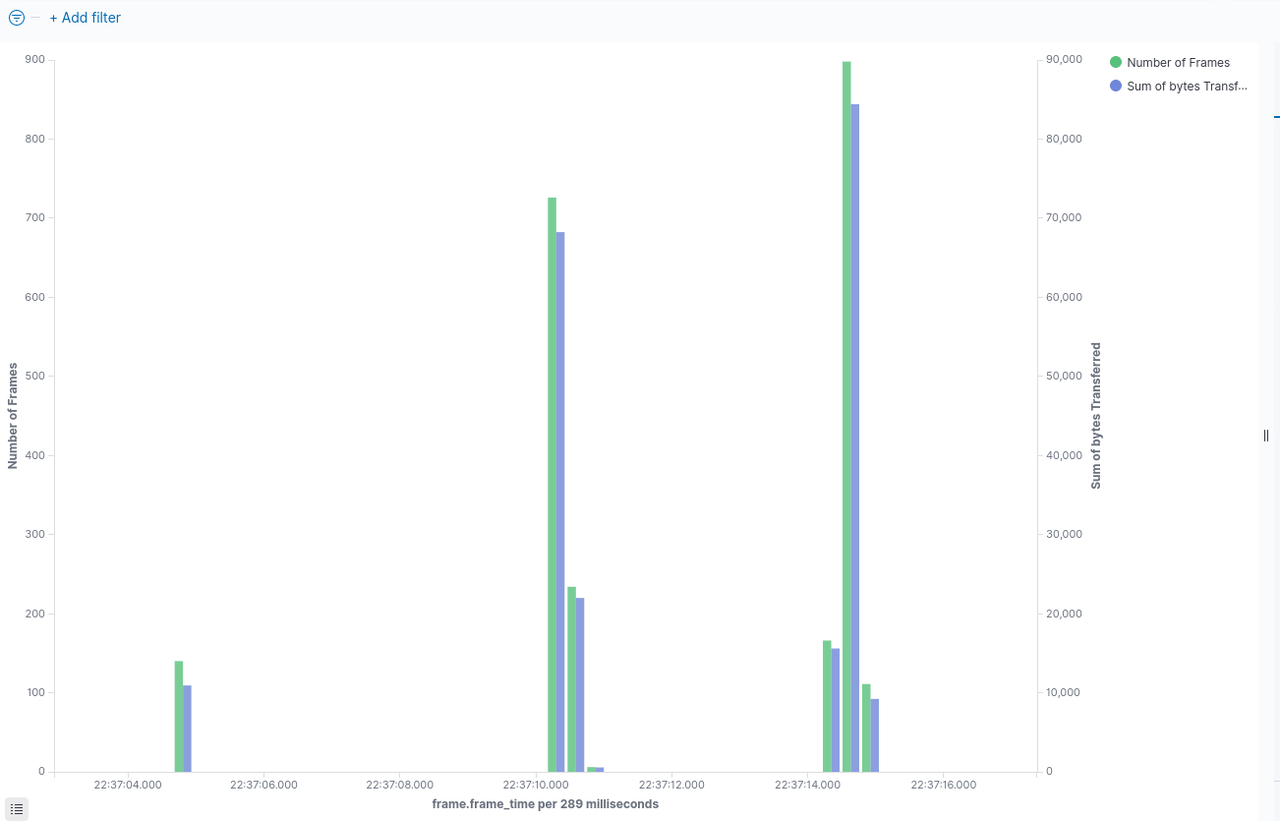
Once the data is available in Elastic, it can be used for creating interesting visualizations. We'll look at a visualization of TCP's congestion control in action using one of the 'Kibana' dashboards. The idea is actually quite simple - Kibana allows one to visualize metrics as buckets - so we simply plot two metrics with X axis as a time. In the first diagram, we can see a Congestion Window opening up in the 'slow start' phase, then some packet loss (as demonstrated by duplicate acks in the second figure.) and then congestion window opening up again. While this is just an example visualization, it shows the kind of analysis and visualizations we can perform once we are able to get the packet data into Elastic.

The Figure Below shows - Duplicate Acks and can be seen that these are present when the congestion window size drops (which happens as a result of packet loss which can be inferred by presence of duplicate Acks)

It's possible to add many such visualizations to dashboards - eg. arrival rate of new flows etc. This is just one example that we can take a look at.
Future Scope
In the current blog post, we looked at one simple visualization using Elastic and Kibana. But there are other features of Elastic that we have not explored yet. For example -
- Wishpy + Elastic vs
PacketBeat- Can we support all the features of Elastic'sPacketBeatusing wishpy but with much larger set of dissectors. - Watchers on Protocol Fields - Can we also setup watchers in Elastic along with dumping live capture data and alert users of interesting events happening on their networks.
Subsequent blog post will look at some of these features.
Code
The code and documentation described in the blog post is available at following URLs.